Chrome Returns 206 when the Server Returns 403
Postmortem
It is a feature not a bug! I got detailed explanation from chrome developers which is very helpful. You may find the complete response in the bug ticket. Also this blog post draws a lot of attention after I post it on Hackers News. You may find comments here.
Updates: I did know the people who replied my issue are not the developers as pointed out by a HN comment.
I was also pretty surprised when the OP said “the Chromium team refused to use my server to reproduce the bug”, when the actual comments of the ticket were “clone this repo and run my giant node app” and the tester’s response was “It seems a bit difficult to set up an build environment to run the static server, could you provide a more minimal repro case?”. OP’s description of the tester’s reasonable concerns seems very unfair.
And I would like to withdraw my statement about Chromium team refused to use my server to reproduce the bug. However, I do believing providing a place to allow users to showcase their weird servers is not a bad idea. Debugging and failure reproduction is always hard! I still think offering GCP credits to issue reporters is a practical approach😁.
You may continue to read the original post if you want to learn an interesting debugging experience.
Original Post
Sorry for the clickbait, but it is true.
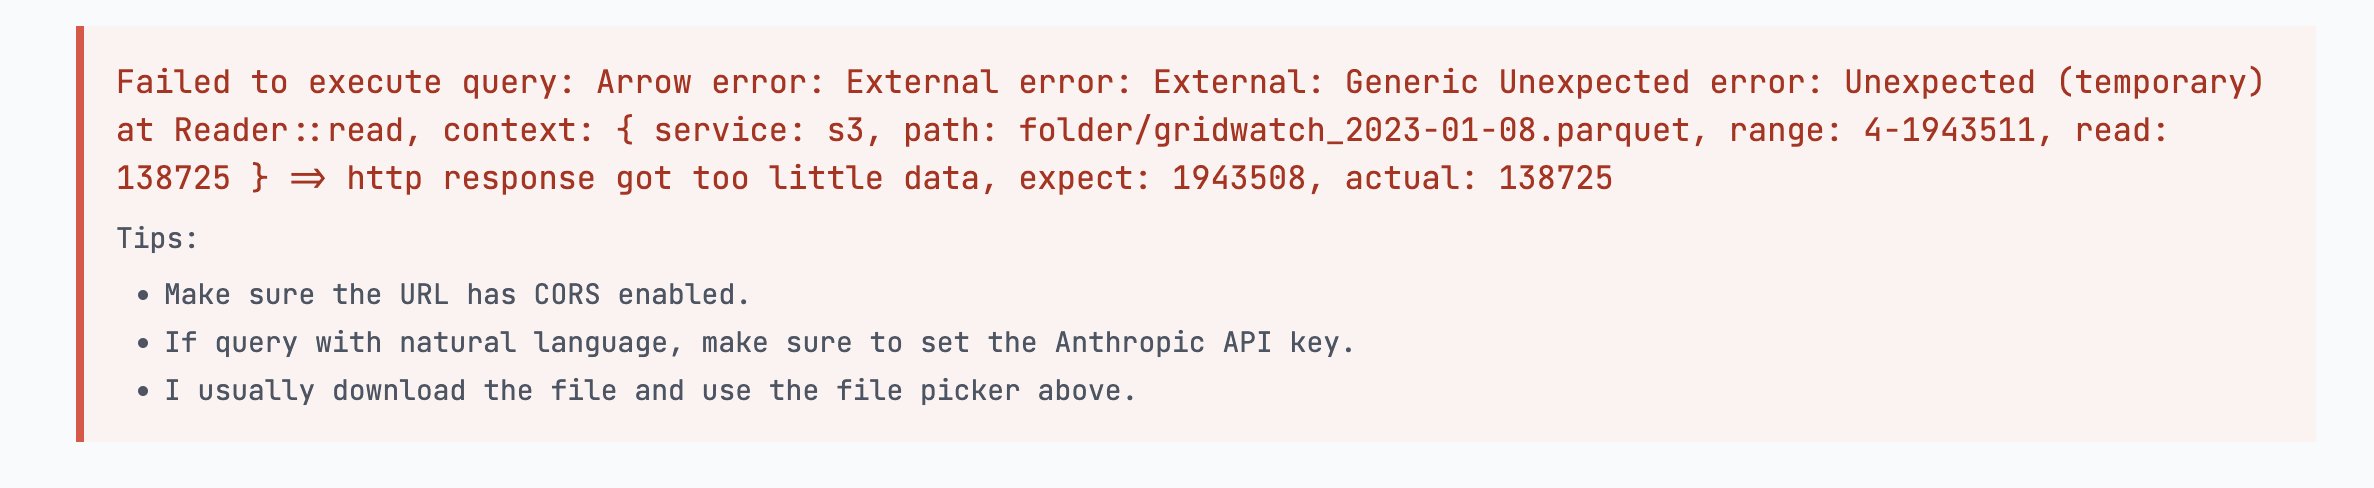
I was helping my partner debug an interesting bug in his fancy parquet viewer. The website crashes when a user tries to access S3.
So the symptom is that OpenDAL (one of the parquet viewer’s dependencies) crashes because it did not receive enough data from S3 storage.
My Initial Attempt
Initially, I thought this was a bug inside OpenDAL, so I tried compiling everything on my native machine, but the bug disappeared. This allowed me to narrow the bugs to all WASM-related components.
My goal was to find the first program location where the data is lost. Unfortunately, debugging the WASM code is not fun, and I have fallen back to print debugging. So I was doing the following manually, starting with parquet viewer:
- download and compile the project
- insert debugging code to print the size of the data
- check if data is already shorter than expected
- if true, download and compile the library it used to fetch the data and go back to step 1
I have gone through Paquet Viewer, OpenDAL, and reqwest and all the way to the standard library. This process wasn’t easy, especially since I needed to find the right location to insert my debug code. Fortunately, LLMs helped me greatly.
But to my surprise, the application received chopped data from the very beginning.
My Second Attempt
Having spent a day debugging nothing was frustrating, and I was questioning what had gone wrong. As a reflection, the main issue of my debugging process is that I set the wrong trust boundary at the very beginning. I was assuming Chrome was functioning correctly and jumped into the rabbit hole of debugging application code.
After removing the trust boundary, the first thing I did was verify what exactly Chrome had received from the server. We found some surprising results with our old friend Wireshark: the server returns 403 for the second request. And more things are going on:
My client sends two requests to the server and I’m using the equivalent fetch command to show them:
The first request has range 4-138724:
1fetch("...", {
2  "headers": {
3    "range": "bytes=4-138724",
4  },
5  "body": null,
6  "method": "GET",
7  "mode": "cors",
8  "credentials": "omit"
9})
The server successfully sends the requested data back and replied 206, and the Wireshark confirms that my server indeed responds to 206.
For the second request, it becomes interesting. The second request has a range 4-1943507:
1fetch("...", {
2  "headers": {
3    "range": "bytes=4-1943507",
4  },
5  "body": null,
6  "method": "GET",
7  "mode": "cors",
8  "credentials": "omit"
9})
However, when Chrome sends the request to the server Wireshark shows that the real request is:
1fetch("...", {
2  "headers": {
3    "range": "bytes=138725-1943507",
4  },
5  "body": null,
6  "method": "GET",
7  "mode": "cors",
8  "credentials": "omit"
9})
The range field is changed. This is because Chrome noticed that the first 4-138724 bytes are already cached, and therefore, it only needs to request the rest part. Hmm, this sounds a great optimization to save data! But when the server responds, it becomes chaotic. Let’s first check what Chrome shows in the response:
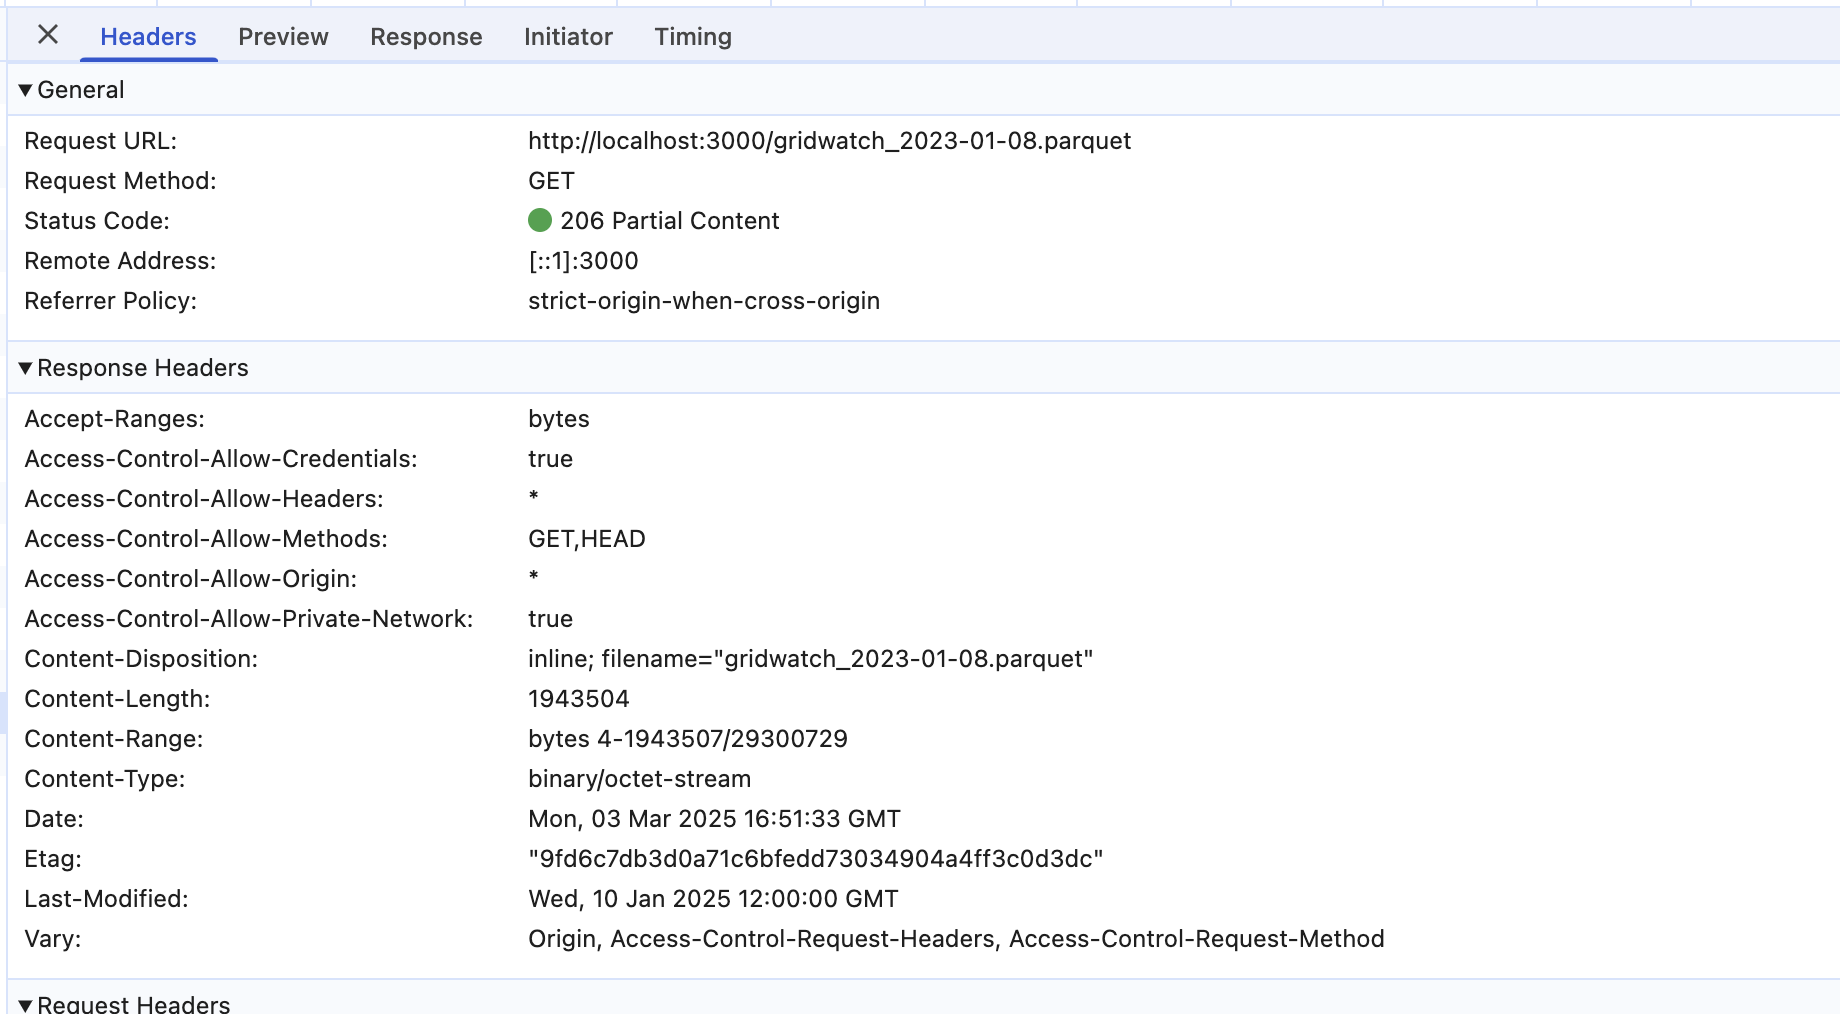
Chrome says it has successfully gotten the data and even indicates bytes 4-1943507 in the response header. But in the response viewer, it shows that the response only has 138720 bytes of data!
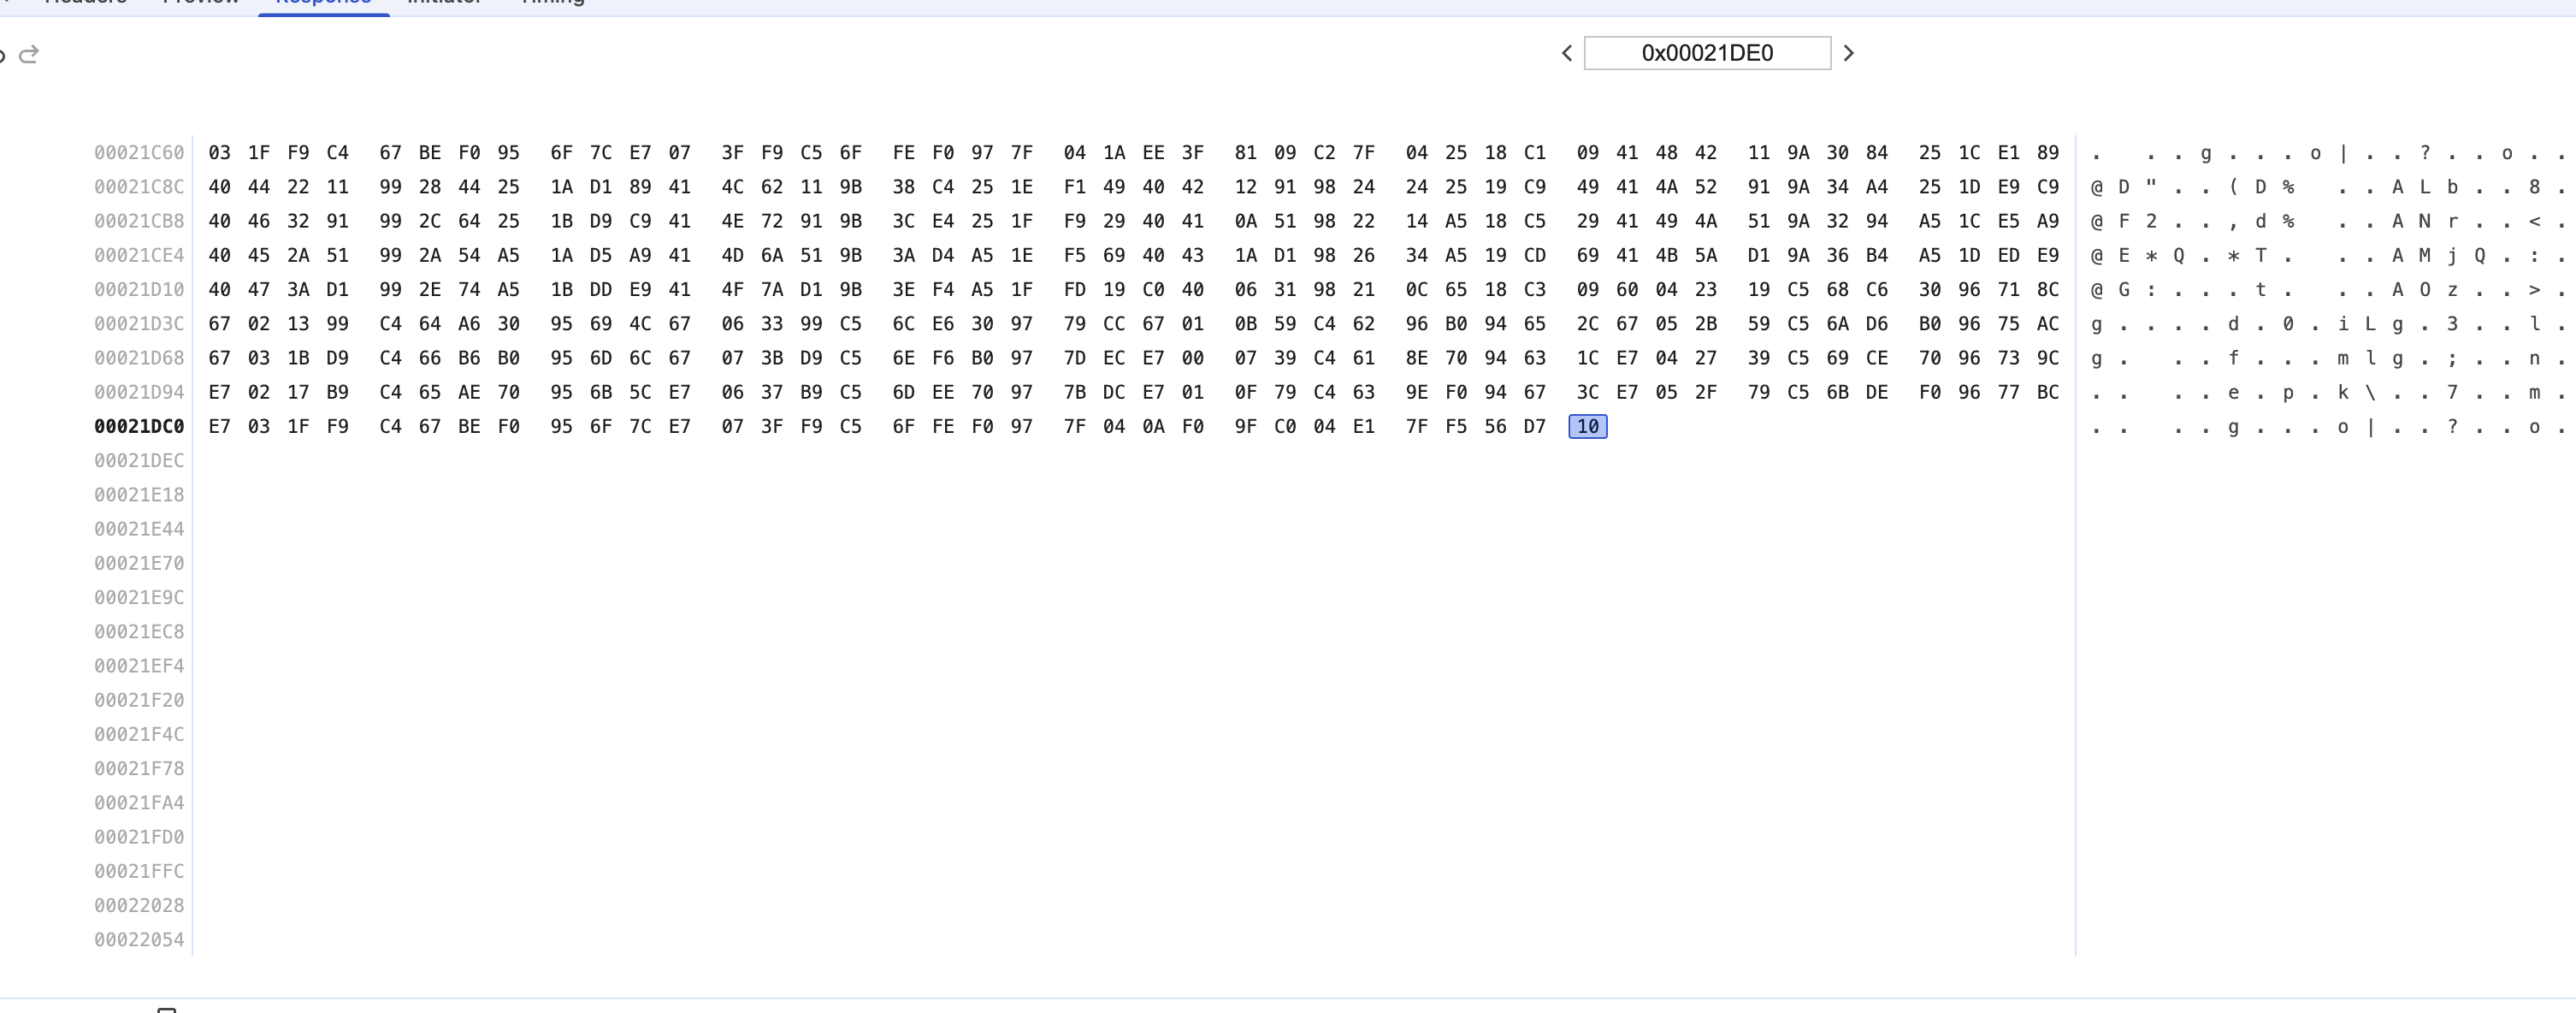
This is crazy. Where did the rest of the data go? Now, if we go back to Wireshark, it will tell us that the second request to the server failed with 403 (it is another story why the server returns 403 for the second request)! However, Chrome still returns 206 to the application with only partial data.
Report to Chromium Team
This seems to be a bug in Chrome, so I decided to report it to the developers. To make their lives easier, I also created a buggy server to mimic the behavior I have encountered.
Here is the issue: https://issues.chromium.org/issues/390229583. You may follow the steps to reproduce the bug if you are interested and I promise, it will not take more than 10 minutes.
Initially, I thought the developers would immediately acknowledge the issue and then fix it. But to my surprise, the issue was open for two months, and eventually, they thought it was a feature, not a bug.
After the issue was submitted, the Chromium team refused to use my server to reproduce the bug and asked me to submit a network log while reproducing it. So I did, out of curiosity. The Netlog looks scary because it not only contains the traffic while I reproduced the bug but also 1) all traffic from the Chrome plugins and 2) many websites that I have browsed before but haven’t visited during the recording. While I promise there is nothing in my browser history 😉. But I still don’t share it with public. So when I share my netlog, I added a restriction to the file.
But to my surprise, this blocks the Chromium team from accessing the file too. After all the back and forth, the Chromium team finally understands the issue. But they think this is a feature, not a bug, and you may find the complete response in the bug ticket.
All we’re saying is that this is how the range requests for partially-cached content in Chrome interact with the cache and it isn’t likely to change because there aren’t any really good ways to change the behavior that won’t also break existing applications. The existing behavior is at least consistent and can be worked with in application code by requesting the missing part of the range after the 2nd request completes (at which point you should get a 403 since none of the range overlaps with what is in cache).
What a bug or a feature! I think I will probably stop tracking this issue since I’m working on neither web technologies nor browsers. I’m just a fan of tracking down and solving those elusive bugs. I opened an issue in OpenDAL because if Chrome is not going to fix it, they may need to fix it.
Also, maybe a lesson for me is that finding the right trust boundary can significantly speed up debugging!